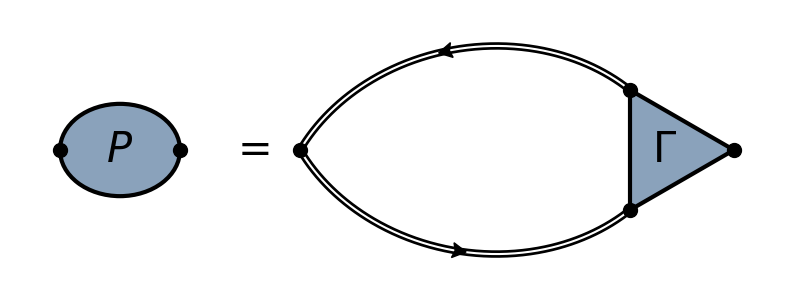
Polarization
A diagram containing different operators.

from __future__ import print_function, division
import numpy as np
import matplotlib.pyplot as plt
from feynman import Diagram

# Set up the dimensions of the figure and the objects
d = Diagram(figsize=(8,3))
d.ax.set_xlim(0, 8/3)
d.ax.set_ylim(0, 1)

textpad = 0.25
opwidth = 0.4
linlen = 1.1
Gamma_side = .4
Gamma_height = Gamma_side * np.sqrt(3) / 2

# Positon of the first vertex
x0 = 0.2
y0 = sum(d.ax.get_ylim()) / 2

# Define line styles
G_style = dict(
    style='double elliptic',
    ellipse_excentricity=-1.2, ellipse_spread=.3,
    arrow=True, arrow_param={'width':0.05},
    )

# Draw the diagram
v01 = d.vertex([x0, y0])
v02 = d.vertex(v01.xy, dx=opwidth)
P = d.operator([v01,v02], c=1.3)
P.text("$P$")

d.text(v02.x+textpad, y0, "=", fontsize=30)

v21 = d.vertex(v02.xy, dx=.4)
v22 = d.vertex(v21.xy, dx=linlen, dy=Gamma_side/2)
v23 = d.vertex(v21.xy, dx=linlen, dy=-Gamma_side/2)
v24 = d.vertex(v21.xy, dx=linlen+Gamma_height)

l21 = d.line(v22, v21, **G_style)
l21 = d.line(v21, v23, **G_style)

Gamma = d.operator([v22,v23, v24])
Gamma.text("$\Gamma$")

d.draw()
plt.show()
Total running time of the script: ( 0 minutes 0.025 seconds)