DCHP1
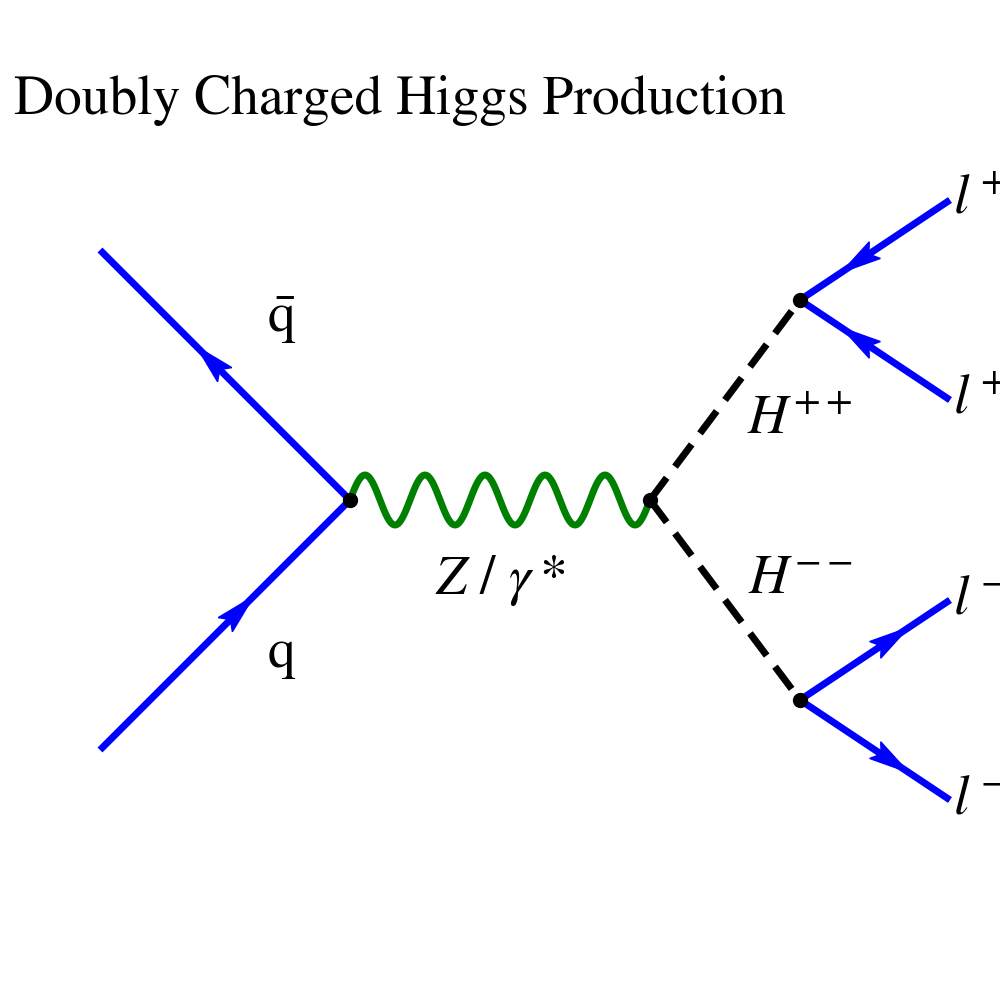
Doubly Charged Higgs Production
import matplotlib
matplotlib.rcParams['mathtext.fontset'] = 'stix'
matplotlib.rcParams['font.family'] = 'STIXGeneral'

from feynman import Diagram

fig = matplotlib.pyplot.figure(figsize=(10.,10.))
ax = fig.add_axes([0,0,1,1], frameon=False)

diagram = Diagram(ax)
diagram.text(.4,0.9,"Doubly Charged Higgs Production", fontsize=40)
in1 = diagram.vertex(xy=(.1,.75), marker='')
in2= diagram.vertex(xy=(.1,.25), marker='')
v1 = diagram.vertex(xy=(.35,.5))
v2 = diagram.vertex(xy=(.65,.5))
higgsplusout = diagram.vertex(xy=(.8,.7))
higgsminusout = diagram.vertex(xy=(.8,.3))
l1plus = diagram.vertex(xy=(.95,.8), marker='')
l2plus = diagram.vertex(xy=(.95,.6), marker='')
l1minus = diagram.vertex(xy=(.95,.4), marker='')
l2minus = diagram.vertex(xy=(.95,.2), marker='')

lw = 5
q1 = diagram.line(v1, in1, color='blue', lw=lw, arrow_param=dict(color='blue', length=0.08, width=0.02))
q2 = diagram.line(in2, v1, color='blue', lw=lw, arrow_param=dict(color='blue', length=0.08, width=0.02))
l1 = diagram.line(l1plus, higgsplusout, color='blue', lw=lw, arrow_param=dict(color='blue', length=0.08, width=0.02))
l2 = diagram.line(l2plus, higgsplusout, color='blue', lw=lw, arrow_param=dict(color='blue', length=0.08, width=0.02))
l3 = diagram.line(higgsminusout, l1minus, color='blue', lw=lw, arrow_param=dict(color='blue', length=0.08, width=0.02))
l4 = diagram.line(higgsminusout, l2minus, color='blue', lw=lw, arrow_param=dict(color='blue', length=0.08, width=0.02))
wz1 = diagram.line(v1, v2, style='wiggly', color='green', lw=lw)
higgsplus = diagram.line(v2, higgsplusout, arrow=False, ls='dashed', lw=lw, dashes=(4, 2))
higgsminus = diagram.line(v2, higgsminusout, arrow=False, ls='dashed', lw=lw, dashes=(4, 2))

q1.text(r"$\bar{\mathrm{q}}$", fontsize=40)
q2.text("q",fontsize=40)
diagram.text(0.5, 0.42, r"$Z \ / \ \gamma*$", fontsize=40)
diagram.text(0.8, 0.58, r"$H^{++}$", fontsize=40)
diagram.text(0.8, 0.42, r"$H^{--}$", fontsize=40)
diagram.text(0.98, 0.8, r"$l^+$", fontsize=40)
diagram.text(0.98, 0.6, r"$l^+$", fontsize=40)
diagram.text(0.98, 0.4, r"$l^-$", fontsize=40)
diagram.text(0.98, 0.2, r"$l^-$", fontsize=40)


diagram.plot()
matplotlib.pyplot.show()
Total running time of the script: ( 0 minutes 0.066 seconds)